Troubleshooting
Quite often in the course of setting up or managing the CMS platform you may find the need to troubleshoot a particular problem either with configuration or day-to-day operational issues. Fortunately, there are several tools at your disposal to isolate issues if they occur. This section will walk you through a few of the tools at your disposal to isolate issues, as well as provide troubleshooting information to the Cisco TAC if required.
Tools
Below, you'll find a list of several of these tools that can be used to diagnose common problems.
Let's begin by taking a look at the various ways these different troubleshooting methods might be employed to gain visibility into what's going on with our CMS cluster in the event of an issue. We will look briefly at each method listed above, but be aware this will not be an exhaustive section. Each of these troubleshooting tools/methods can be used far beyond what we will take a look at in this lab. The goal of this section is to simply give you an idea of some of the ways to begin looking into common problems.
Webadmin
One of the first places to check when you suspect an issue with CMS is the Webadmin interface. Webadmin, when enabled, offers a quick glance at what the current state of the local node and cluster might be. You can check things like alarms as well as gather certain logs and enable detailed tracing. There are also some hidden areas that provide valuable information which we will look at.
System Status
Let's first take a look at the System Status on the General page to see if there are any glaring issues.
- Browse to https://cms1a.pod2.cms.lab:8443 (Note that we're browsing to CMS1C, there's a reason for this we'll see a bit later).
- You should see a login screen like this:
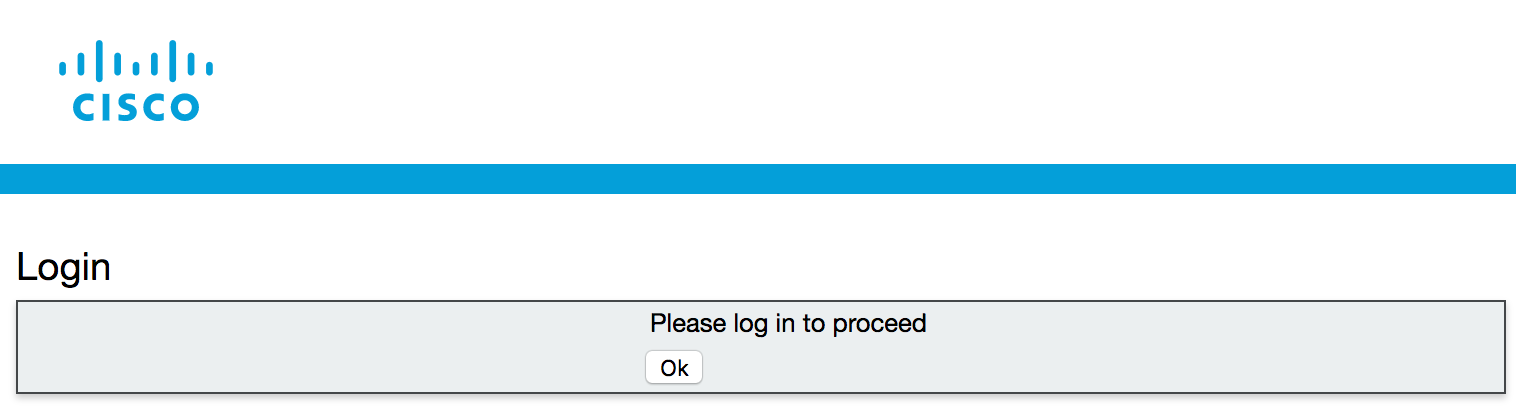
- Press Ok to get the username / password prompt.
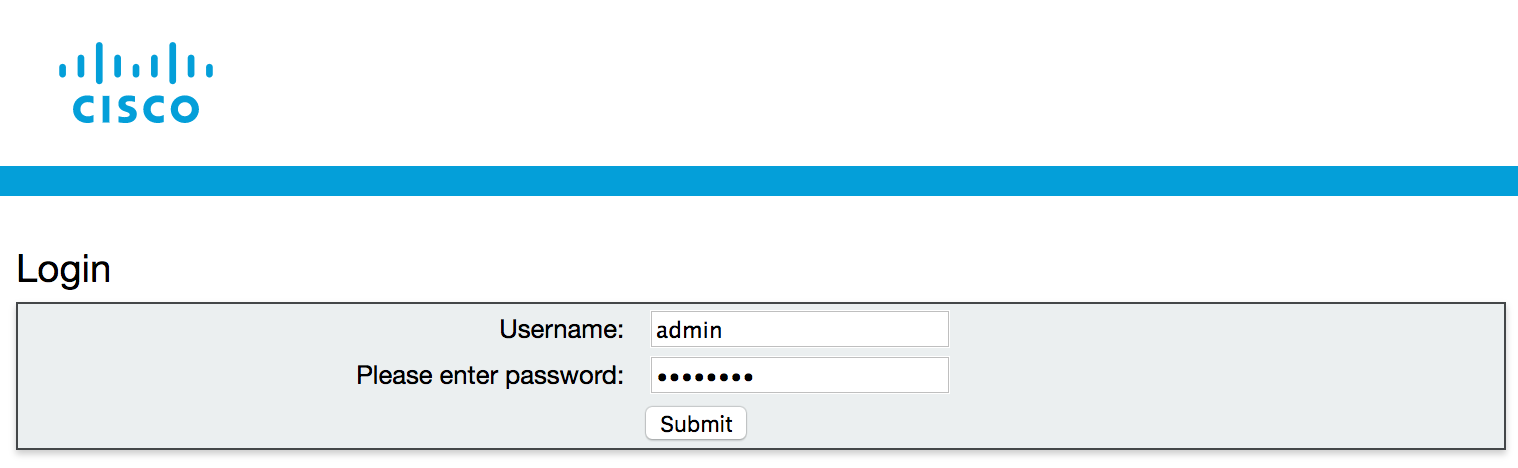
- Then enter the credentials
(Username: admin,
Password: c1sco123)
and press Submit.
-
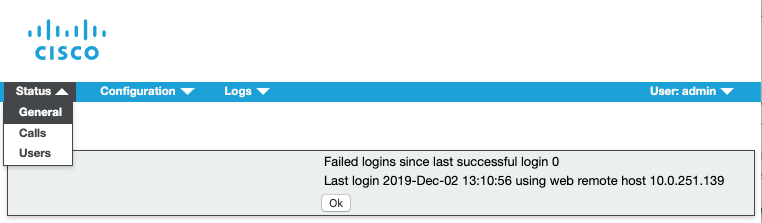
Once logged in, let's browse to the General page by using the menu shown below.
-
Take a glance at the page to see if there are any errors or warnings present. This page will list any Fault Conditions
and Recent errors and warnings. In the example below you can see a database connection error
in the Fault Conditions section and a schema version error in the Recent errors or warnings
section.
Detailed Tracing
Another way to take advantage of troubleshooting capabilities in the Webadmin interface is by enabling Detailed Tracing and viewing logs within the web browser. By enabling detailed tracing, you insure that the logs which are accessible in the browser (and in the downloadable syslog files) contain detailed trace information for troubleshooting purposes. Without enabling detailed tracing, the syslog messages logged will not contain more detailed troubleshooting information necessary to isolate certain issues.
-
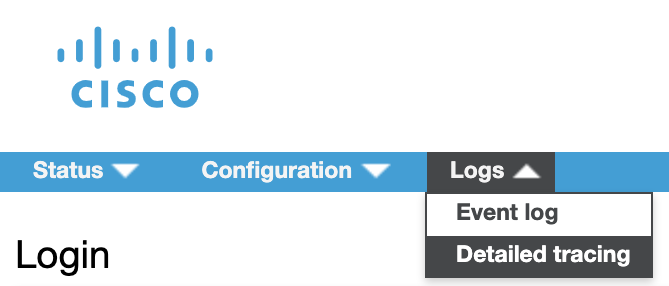
While still logged into CMS1C, let's browse to the Detailed Tracing page by using the menu shown below.
-
Currently, the detailed Sip Traffic Tracing is Disabled. Let's enable
detailed Sip Traffic Tracing for 24 hours by clicking the button shown below.
-
After doing so, instead of Disabled, it should now show as enabled for the next 23 hours, 59
minutes, and 59 seconds
-
Now, let's browse to the Event log page.
-
Clear the event log by selecting the Clear hyperlink as shown below and confirm by selecting
Ok
-
Now place a call to
pod2user4.space@conf.pod2.cms.lab
from the Jabber client.

-
After the call is established, click the download as text link which will take you to a text file containing the syslog
messages from cms1a which include detailed SIP messaging.
- Let's search for the SIP INVITE message for the call we just placed. Press CTRL + F on your laptop keyboard to bring up the Find dialog in your Chrome browser. Type INVITE sip:. Since we just cleared the logs, there should only be one SIP INVITE message in the log which comes into cms1a. In much the same way, you can search for other messages using this method to try to narrow down issues with SIP signaling, API-related problems, or any of the other items shown on the Detailed tracign page. This is a great first step in isolating problems.
-
You can now end the call by selecting the
 button from the Jabber
call window.
button from the Jabber
call window.
Hidden Troubleshooting Pages
A little-known fact about CMS is a collection of hidden pages designed to provide certain information about individual CMS servers and the cluster as a whole. These pages are accessible once you've logged into the Webadmin interface, but are not linked-to from the standard menus at the top of the GUI. You won't find these pages documented officially and are not supported by Cisco TAC, but they can be useful for certain tasks that are only accessed via other methods such as the API. Our goal is simply to show you what tools are available and allow you to choose the right tool for a given task. With these caveats in mind, let's explore these hidden pages briefly.
- Let's browse to https://cms1c.pod2.cms.lab:8443.
- If you've been logged out due to inactivity, you should once again see the login screen:
- Press Ok to get the username / password prompt.
- Enter the credentials
(Username: admin,
Password: c1sco123)
and press Submit.
- Once logged in, use your Chrome web browser's address bar to browse to https://cms1c.pod2.cms.lab:8443/debug.html (click to copy)
-
You'll be presented with the following page. Each of the hyperlinks on the page leads to another hidden page described above. Take some time to explore each of the pages to see the information contained therein.
CMS displays a landing page with some useful information regarding the current node including Version, Uptime, CPU Usage (current and average) and other information. In addition, there are links to other pages you can access from the Webadmin interface including cmd.html where you can issue certain CLI commands, memory.html where you can learn everything you ever wanted to know about memory allocation on the server, placement.html which has useful information about the current call processing node - in particular the free/used/limit information regarding the current node. What this means is that you can see a snapshot of your currently active node at any given time and how many calls it can handle. In addition to these there are several more pages worth looking at.
There are many items we could highlight to show the value of these hidden troubleshooting pages, but perhaps a useful example would be to take a look at would be on the placement page where we can determine what load the system is under and on different platforms like the CMS 2000 server can even show you what media module (blade) the call lands on.
-
Click on placement.html which will take you to the placement page, meant to show, among other things, how many media modules are in service and where the calls on CMS are being serviced from. On the CMS servers we're using, there is only one media module, but on the legacy Acano X-Series servers there were several, as well as on the CMS 2000 platform which is a current CMS platform.
As you can see, there's a lot of information on this page. In particular, notice that it shows the number of active calls present on this server. It also displays the resource utilization for the media module present within this VM. They are displayed in the format free/used/limit.
Notice, in particular, the line on the screenshot below which begins with
 .
If we were on the CMS 2000 platform, for instance, we would see 7 lines that begin this way, each of which
represent a separate media module (UCS Blade Server) on the chassis. Each media module is identified by a
name beginning with BEEF and subsequent modules would be denoted by 0200,
0300, and so on. There's a screenshot taken from a CMS 2000 below showing the additional
media modules as an example.
.
If we were on the CMS 2000 platform, for instance, we would see 7 lines that begin this way, each of which
represent a separate media module (UCS Blade Server) on the chassis. Each media module is identified by a
name beginning with BEEF and subsequent modules would be denoted by 0200,
0300, and so on. There's a screenshot taken from a CMS 2000 below showing the additional
media modules as an example.
- Now we're going to make a call with one leg hosted on CMS1C so that we can see the resource utilization on the placement page (this is the reason we logged into CMS1C instead of another node). Make sure you have a Remote Desktop session up on PC2 (10.0.102.92)
- Using Cisco Jabber on your laptop, click to call our Space at pod2user4@conf.pod2.cms.lab
- From PC2's Jabber client, call the same Space, but this time send the call to CMS1C by dialing pod2user4@cms1c.pod2.cms.lab
-
Refresh the placement.html page and you should now see that there are two active calls on CMS1C, one is the call we placed from PC2, and one is the distributed call joining the call on either CMS1A or CMS1B to this call because CMS1C is in a different Callbridge Group.
Note that we can see the resources consumed on CMS1C by looking at that middle number shown in the screenshot below. If this were a CMS 2000 platform, we could also tell what Media Module the call landed on, which might help to isolate issues observed to a particular blade server.
- When finished, use your laptop to disconnect PC2 User by hovering over User 2 in the participant list, then right-clicking the user and selecting Expel and confirming.
-
Once User 2 has been disconnected, hang up yourself by hovering over the video window and
clicking on the button.
Command Line Interface (CLI)
Syslog Follow
Depending what type of issue you're troubleshooting, there are some useful troubleshooting steps that can be performed via the CLI interface on each CMS server in your cluster. One of these steps is to issue the syslog follow command, which will provide a stream of syslog messages to the console and can be useful if the amount of syslog messages is somewhat small, or if you have a small cluster and need to isolate which node is handling a particular call, for instance.
-
Log into cms1a.pod2.cms.lab (password: )
-
Issue the following command from the CLI interface.
cms1a> -
You should start to see syslog messages scroll on your terminal window. As you might imagine, this method of troubleshooting
should be reserved for small issues or issues where a particular syslog message is expected when placing tests calls. If
we make our test call again to
pod2user4.space@conf.pod2.cms.lab,
we will see the same SIP INVITE message scroll by on the screen, but because of the volume of messages, it can get quickly lost.
-
Place a call to pod2user4.space@conf.pod2.cms.lab.
- From the CLI, use your keyboard to send CTRL + C to stop the syslog messages from scrolling by. You can scroll up and see the same SIP messages that we just observed via Web Admin, but because it's on the CLI it's not quite as easy to search and sort through. It is, however one more tool in your toolbox to try to isolate issues.
Packet Captures
Another troubleshooting step that can be performed from the CLI is to start a packet capture that can then be downloaded via SFTP for analysis. This packet capture will show all packets entering or exiting a given interface on the CMS server. The packet capture is limited to 100MB.
-
Log into cms1a.pod2.cms.lab (password: )
-
Issue the following command from the CLI interface.
cms1a> Packet capture running: press Ctrl-C to stop -
This will start the packet capture on cms1a.
-
Place a call to pod2user4.space@conf.pod2.cms.lab.
-
Let the call run for 30 seconds or so and then end the call with the button.
-
From the SSH session on cms1a press Ctrl+C.
cms1a> pcap a Packet capture running: press Ctrl-C to stop ^CTransferring packet capture: please wait... Packet capture available in admin-a-20191130-191054.pcap Captured 5201 packets, 424416 bytes cms1a> - As you can see, the packet capture was saved with a name denoting the interface, date, and capture number.
- Double-click the CMD icon on the Desktop. This will bring up a CMD window.
- Now let's establish an SFTP session to cms1a
to view the remote files
-
Now that you're connected to cms1a, let's download the packet capture to our local system.
First, let's get the name of the pcap by issuing the following command command:
psftp> dir admin* Listing directory / -r--r--r-- 1 admin admin 424416 Nov 30 16:37 admin-a-20191130-191054.pcap -
Next, get the packet capture by issuing the SFTP GET command for the filename in question. The filename will vary from pod to pod,
so make sure you copy the filename from your pod after you list the remote directory contents.
psftp> get ****YOUR PCAP FILENAME**** remote:/****YOUR PCAP FILENAME**** ==> local:****YOUR PCAP FILENAME****
- The file should now be on your local filesystem and able to be viewed by using Wireshark, but is outside the scope of this lab
|
psftp admin@cms1a.pod2.cms.lab
Using username "admin".
Using keyboard-interactive authentication.
Please enter password: c1sco123
Connected to cms1a.pod2.cms.lab.
Remote working directory is /
|
This is a very useful troubleshooting step that may even be requested by Cisco TAC under certain circumstances. For reproducible issues, you may be required by TAC to start a packet capture before reproducing a failed call, for instance. In the event that this is required, you can see that it's a fairly simple procedure.
SFTP
Directory Listing
A listing of all user-accessible files can be viewed by establishing an SFTP session to individual CMS nodes. These files include certificates and keys, license files, crash dump files, backup files, an audit log, pcaps.
- Double-click the CMD icon on the Desktop of your laptop. This will bring up a CMD window.
- Now let's establish an SFTP session from your laptop to cms1a
to view the files on the remote server.
-
Now that you're connected to cms1a, you should be able to list the files available by
issuing the command:
psftp> dir Listing directory / *** omitting certain files for brevity *** -r--r--r-- 1 admin admin 3642 Mar 01 16:37 ACANO-MIB.txt -r--r--r-- 1 admin admin 1267 Mar 01 17:06 ACANO-SYSLOG-MIB.txt -r--r--r-- 1 admin admin 286556160 Mar 23 23:19 upgrade.img -r--r--r-- 1 admin admin 96256 Mar 25 10:07 2_5_2.bak -r--r--r-- 1 admin admin 81666 Nov 04 10:12 cms1a.csr -r--r--r-- 1 admin admin 81666 Nov 04 10:12 cms1a.key -r--r--r-- 1 admin admin 81666 Nov 04 10:20 dbclusterserver.key -r--r--r-- 1 admin admin 81666 Nov 04 10:20 dbclusterserver.csr -r--r--r-- 1 admin admin 81666 Nov 04 10:20 dbclusterclient.csr -r--r--r-- 1 admin admin 81666 Nov 04 10:20 dbclusterclient.key -r--r--r-- 1 admin admin 81666 Nov 04 10:25 dbclusterserver.cer -r--r--r-- 1 admin admin 81666 Nov 04 10:25 cms1a.cer -r--r--r-- 1 admin admin 81666 Nov 04 10:25 cms1abc.cer -r--r--r-- 1 admin admin 81666 Nov 04 10:25 cmslab-root-ca.cer -r--r--r-- 1 admin admin 81666 Nov 04 10:25 dbclusterclient.cer -r--r--r-- 1 admin admin 2180404 Nov 04 14:22 call_branding.zip -r--r--r-- 1 admin admin 81730 Nov 27 08:47 boot.json -r--r--r-- 1 admin admin 81666 Nov 30 17:40 cms.lic -r--r--r-- 1 admin admin 81666 Nov 30 17:40 live.json -r--r--r-- 1 admin admin 1580636 Nov 30 17:40 audit -r--r--r-- 1 admin admin 84036440 Nov 30 17:40 log -r--r--r-- 1 admin admin 1 Nov 30 17:40 logbundle.tar.gz
Certain files have been highlighted because we have not talked about them previously in the lab. The upgrade.img file is the file used to upgrade CMS from a previous version. Any backups taken during the course of those upgrades will have the .bak extension, as you see 2_5_2.bak has. boot.json and live.json files, for instance, which are configuration files denoting the startup configuration and running configuration of the CMS server respectively. The audit log contains audit information regarding logins and errors for the CMS server. log is the syslog file which gets packaged in the next file we see, logbundle.tar.gz
Each of these files may be required for certain troubleshooting scenarios. In this case we want to make you aware of what they are and what information they contain
|
psftp admin@cms1a.pod2.cms.lab
Using username "admin".
Using keyboard-interactive authentication.
Please enter password: c1sco123
Connected to cms1a.pod2.cms.lab.
Remote working directory is /
|
logbundle.tar.gz
Since version 2.2 of Meeting Server, the ability to collect logs via this single file has been available via SFTP. Included in this file is a copy of the CMS database, any .dmp files information on currently active calls, and syslog files. Note that the syslog file will only contain detailed logs if those logs have been enabled via the Webadmin interface (Logs --> Detailed Tracing). To collect this file, we will simply connect via SFTP to cms1a and issue the GET command.
- Double-click the CMD icon on the Desktop of your laptop. This will bring up a CMD window.
- Change to the Downloads folder by entering cd %userprofile%\Downloads
- Establish an SFTP session to cms1a
to view the remote files
-
Now that you're connected to cms1a, issue the command:
psftp> get logbundle.tar.gz remote:/logbundle.tar.gz => local:logbundle.tar.gz
|
psftp admin@cms1a.pod2.cms.lab
Using username "admin".
Using keyboard-interactive authentication.
Please enter password: c1sco123
Connected to cms1a.pod2.cms.lab.
Remote working directory is /
|
Once you have the archive, it can be extracted and its contents viewed. Shown below are the contents of the
logbundle:
This single archive is arguably one of the most important single troubleshooting files made available by CMS, and will often be requested by Cisco TAC engineers in their efforts to solve certain problems. Extracting the logbundle may be accomplished using 7Zip and various other utilities, but is beyond the scope of this lab. Awareness of this file, as well as what is contained within it is our focus today.
API
The API can be used for certain troubleshooting tasks as well. For instance, we can use it to query individual Callbridge nodes to see what their current load level is. We can also use it to obtain call diagnostic information or query the cluster to see what alarms are active, if any. For certain tasks, the API can be a very valuable troubleshooting tool.
For the scope of this lab, we will focus on one particular aspect of the API for troubleshooting purposes. It is possible to gather call diagnostic information using the API.
- To gather diagnostic information on a call, there first must be a call to investigate. For this reason, we need to make a call that we know will land on one particular Callbridge. We will use a similar method that we used earlier in the troubleshooting section and insure our call has one leg hosted on CMS1C since it is the only node in the West Callbridge Group. Make sure you still have a Remote Desktop session up on PC2 (10.0.102.92), or re-establish one if you closed that window.
- Using Cisco Jabber on your laptop, click to call our Space at pod2user4@conf.pod2.cms.lab
- From PC2's Jabber client, call the same Space, but this time send the call to CMS1C by dialing pod2user4@cms1c.pod2.cms.lab
- Launch Postman using the desktop shortcut.
- Change the verb to GET.
- Enter the following URL in the address bar to target the calls entity. We need to get the call ID in order to enable
diagnostics for that call:
. Hit Send.

We should see the call information including the Call ID that we need to enable diagnostic information on this call.
-
The next step is to enable diagnostic information for this call. We need to copy the Call ID from our previous step
and use that in the the URL in Postman while changing our verb to POST Our final url will end up looking like this:
https://cms1c.pod2.cms.lab:8443/api/v1/calls/***CALLID***/diagnostics. Replace the Call ID with
your own. In this example the finished URL would be:
.
Make sure the verb is set to POST and hit Send
-
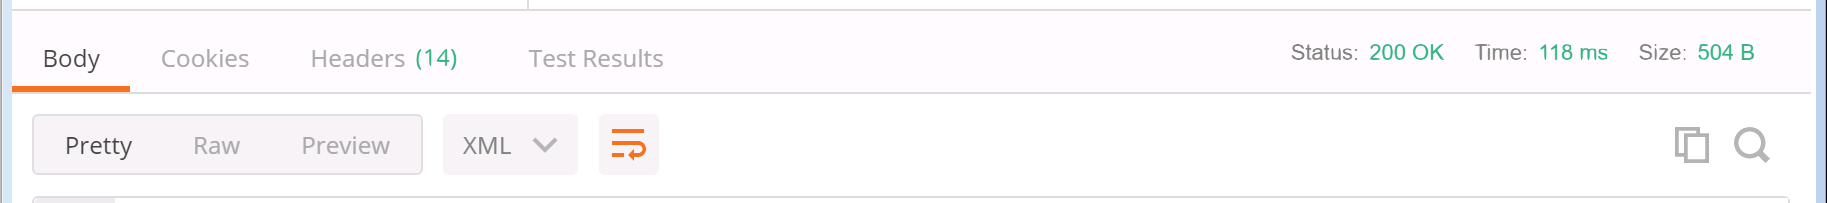
You should get a 200 OK message back. This message is important, because in the headers of that
message is a location we need to use for our next Postman transaction. If you look at the headers tab on the response we just received,
you'll see a location header.
-
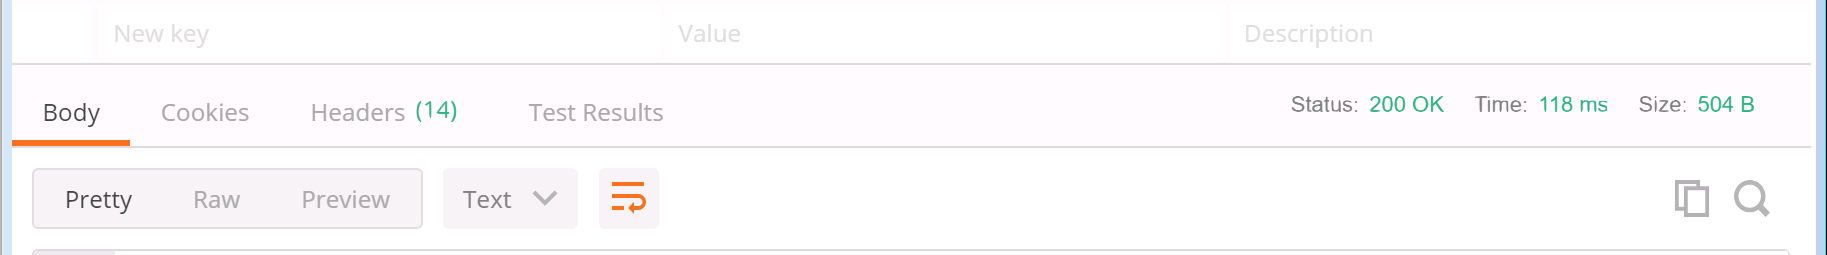
Copy this location, and paste it in the Postman address bar followed by
/contents, so it looks something like this, then hit Send:
- What you should see is a good deal of useful diagnostic information about the current call. Take a look through the log information and familiarize yourself with the information returned.
- When finished, use your laptop to disconnect PC2 User by hovering over User 2 in the participant list, then right-clicking the user and selecting Expel and confirming.
-
Once User 2 has been disconnected, hang up yourself by hovering over the video window and
clicking on the button.
This concludes the troubleshooting section of the lab. Hopefully you have a better idea what tools are available to you as a CMS user, and can select the right tool for the job of troubleshooting any issues that may occur. While we would love to have a product that never has any issues, the reality is that there is always a need to understand and diagnose behavior that we don't understand in this or any product we may be using. Better understanding what tools are available to us can speed our time to resolution and provide a better overall user experience.